Vous êtes ici : Accueil |
|
Explosions details (2008b)
Geophysical data (2008b)
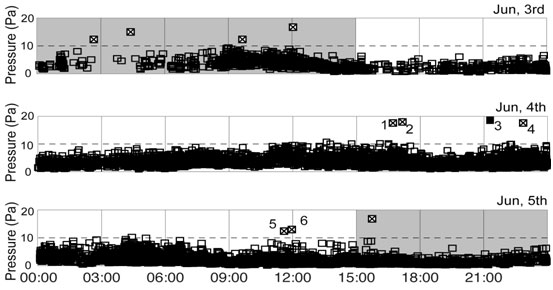
Sound azimuth graphs relative to 48 hours long period of sampling: from June 3rd at 15:00 GMT, when the plastic sheets were deployed, to June 5th at the same hour when they were taken back. The dataset is relative only to SW explosions. The grey bands indicating no sampling period; white crossed squares and the black one (3) that have pressures greater than 10 Pa, are explosions (11 explosive events during the three full days detected by the infrasonic array). Numbers next to the squares (1 to 6) indicates the possible six explosive events able to give the bombs distribution. The black full square is the more plausible explosion.
Seismic and pressure trace of the explosive event which generated the scoria bombs distribution. Sample quantifications (2008b)
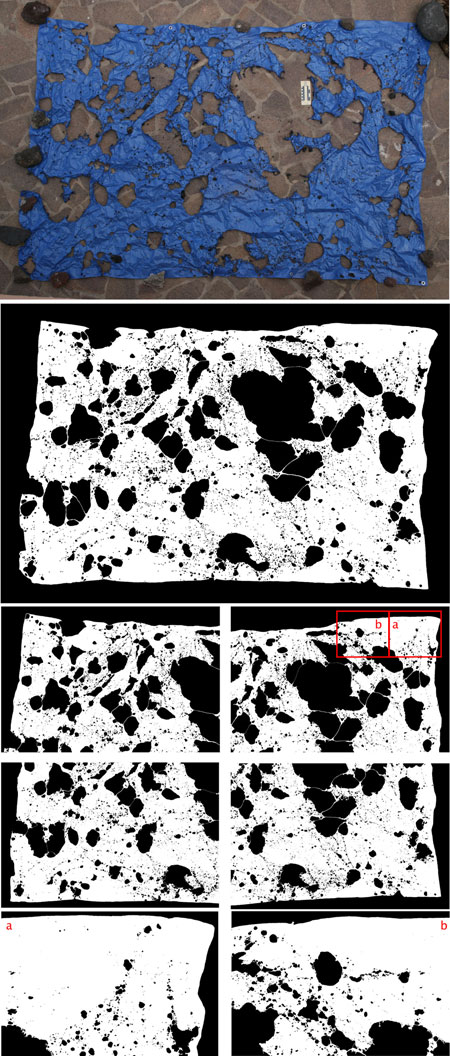
Tarps location
|
||||||||||||||||||||||||||||||||||||||||||||||


|

|
|