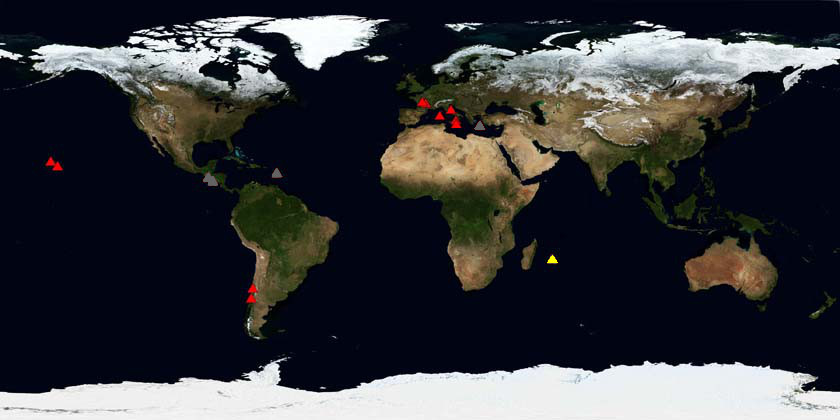
Vous êtes ici : Accueil>>Data Base


Recherche


DYNVOLC database

Data currently available : Kilian, Stromboli, Etna, Villarrica, Mauna Ulu (click on red volcano).

Data available with virtual observatory : Piton de La Fournaise (click on  yellow volcano ).


Take me to the Virtual Observatory portal

Citation with Digital Object Identifier (DOI)

Citation: DYNVOLC Database (2017): DYNVOLC Database. Observatoire de Physique du Globe de Clermont-Ferrand, Aubière, France. DOI:10.25519/DYNVOLC-Database. Online access: http://dx.doi.org/10.25519/DYNVOLC-Database

Data base general information

This data base is an integrated collection of data from physical and geophysical observations of dynamic volcanic processes. The data base spans the full range of explosive and effusive activity types, and represents a library of standards for case type eruptive styles. For each eruptive style, the data base provide and link:

  • field data (i.e., the results of field mapping, outcrop and sample descriptions),
  • textural and chemical analyses of samples, (i.e. vesicle and crystal size distributions)
  • their associated geophysical measurements.

These data not only provide insights into the dynamics driving each eruptive style, but also allow us to define the rheological and degassing conditions associated with each activity style while also providing important physical parameters that often need to be assumed by geophysical data reduction methods as well as modeling.

Time series observations

Temporal resolution
Field based time series observation at active volcanoes can span periods of seconds for a single, short, eruption (e.g., Ripepe and Harris 2008) to years during persistent effusive or explosive volcanic activity (e.g., Sutton et al. 2003), while for past activity we have monthly-to-annual temporal resolutions

Geophysical measurements can be made at sampling rates of hundreds of Hz using ground-based instruments such as seismic, acoustic, thermal stations or a combination of all three (e.g., Ripepe et al. 1999; 2001), as well as Doppler radar (e.g., Gouhier and Donnadieu 2008), satellite-based thermal sensors can reveal trends developing over hours using geostationary satellites (e.g., Harris et al. 1997a; Harris and Thornber 1999) to days-to-months using polar orbiting satellites (e.g., Harris et al. 2000; Gouhier and Coppola 2011). In addition, ground-based spectrometers can extract SO2 degassing rates at similar temporal resolutions (e.g., Edmonds et al. 2003; Horton et al. 2005).

Field based data
Field parameters can be attained from field campaigns on active, or quiescent, volcanoes allowing us to obtain physical parameters on the basis of deposit analysis and sample return (e.g., Lipman and Mullineaux 1981; Lipman and Banks 1987; Moore 1987; Newhall and Punongbayan 1996; Druitt et al. 1999).
Outcrop examination for pyroclastic deposit or lava flow dispersion, extent, thickness, architecture, morphology, componentry and grain size (e.g., Fisher and Schimcke 1984; Cas and Wright 1987; Naranjo et al. 1992; Kilburn and Guest 1993). Note here, I use the word “deposit” and “outcrop” to cover those composed of pyroclasts and lava; while Fisher and Schimcke (1984), for example, detail how we can deal with deposits and outcrops composed of pyroclasts, and Kilburn and Guest (1993) deal with 'a'a lavas. Next, analyses of the erupted products allow the texture (vesicle and crystal size distributions) and chemistry (in terms of petrography, chemistry and geochemistry) to be defined and tracked (e.g., Carrol and Holloway 1994; Herd and Pinkerton 1997; Polacci and Papale 1997; Cashman et al. 1999).
Classical field-based measurements are presented to obtain the dispersion, thickness and bulk density of effusive and explosive deposits. Observations and measurements are made following:

  • For lava flows Walker (1967), Lipman and Banks (1987), Kilburn and Lopez (1988), Naranjo et al. (1992), Kilburn and Guest (1993), Cashman et al. (1999) and Manga and Ventura (2005) provide examples of what parameters can be measured and how they should be measured.
  • For the fallout deposits, the IAVCEI Commission on Tephra Hazard Modelling (http://dbstr.ct.ingv.it/iavcei/) provide guidelines on measurements that need to be made.
  • Fisher and Schimcke (1984), Cas and Wright (1987), Freundt and Rosi (1989) and Branney and Kokelaar (2002) also detail outcrop measurements and observations for the pyroclastic density currents deposits, as well as fallout deposits.

Textural data:
Characterization of the data base comprises information regarding key measured, and inferred, shallow system magma parameters during single “case-type” events through vesicle size distribution, crystallinitiy, chemistry, viscosity, yield strength.
This allow us to link to the time-varying nature of the associated activity to variation in geophysically measurable parameters for the explosive emission, such as tremor or source location, as described above in the research section of this proposal. For the textural variations see the routine measurement section, as well as Houghton and Wilson 1989, Shea et al. 2010.

Chemistry data
Glass chemistry will be used for the classification of the products, as well as an indicator of their temperature and degree of evolution. Both the chemistry and crystal content can be used to estimate magma viscosity, which in turn can be incorporated into models of conduit flow based on remote sensing data. The chemistry side will be carried out mostly using the microprobe and the ICP-AES at LMV. It will mostly involve extraction of major element chemistry (whole rock and glass), which will be entered as a first level (primary data) parameter in the data base. These can be used in chemically-based viscosity and density conversions [see Harris and Allen (2008) for review and examples]. At the same time temperature conversions can be carried out following using geobarometry (e.g., Helz and Thornber 1987; Pompilio et al. 1998). Such conversions and extractions will be entered as second level (i.e., results derived from the primary data) parameters in the data base, along with all the conversion equations and parameters used, and their sources. In this way, the user can check the conversion, and/or complete a new conversion using modified input parameters.

Geophysical data
Measurable parameters include fragmentation depth, ejection and ascent velocity, fragment and gas mass, as well as variations in these parameters with height and time (e.g., Harris and Ripepe 2007; Sahetapy-Engel and Harris 2009; Gouhier and Donnadieu 2008). This allows us to relate the magnitude and intensity of the events to the character of the products, and also allows a geophysical classification which divides eruption styles depending on the dominance of the gas thrust versus the convective phase of the plume ascent (Marchetti et al. 2008). In addition, we can associate characteristics thermal, seismic or infrasonic waveforms with characteristic eruption styles (e.g., Harris et al. 2000; Harris and Ripepe 2007; Ripepe and Harris, 2008).

DYNVOLC data base architecture

Throughout these sections we offer a brief description of the type of data included in each of the information classes.

For each volcano we provide one or two geological maps or digital elevation model maps of the study area, where we insert the studied locations

Volcano details
This class includes the fields: country, location, coordinates (latitude, longitude), height of the volcano (taken at the crater, or around the craters area), age (the age of the volcanic edifice that we can see) volcano type (stratovolcano, monogenic etc), activity (explosive and/or effusive), magma composition (refer to a general composition that characterize that magma that can be asaltic, trachytic, rhyolitic and so on), bulk composition (when the bulk composition is the same for all the activity), magma density (it is the value of the density refer to magma that is found with crashed samples, see the routine measurements)

Eruption details
This class includes the fields: activity (define the kind of activity of the studied explosion/eruption or effusive activity), dates of the eruption (beginning and end of the eruptive event)
When we have the geophysical signature of the explosion we can also provide: explosion depth (the depth of the explosion in the conduit), the very long period (VLP) acoustic signal source from the surface, the slug velocity (conduit size big bubble or train of bubbles that are supposed to form during a strombolian event), the ejecta velocity in the conduit (the particle velocity after the explosion level in the conduit, the pyroclastic particle velocity (at the exit from the vent), the particle maximum height (that they reach in the atmosphere) and their fall distance from the vent (for the methodology see Harris and Ripepe 2007, Gurioli et al 2013).

Geophysical data
This class includes the fields: seismic displacement (seismic shacking in velocity in the VLP band frequency, Chouet et al. 1999, 2003; Marchetti and Ripepe 2005), acoustic pressure (overpressure release at the magma free surface,that represents the bursting of gas bubbles recorded as acoustic pressure that propagates in the atmosphere as an infrasonic wave. The infrasonic amplitude is a function of gas overpressure and bubble volume Vergniolle and Brandeis 1994, 1996; Ripepe et al. 2001, Ripepe and Marchetti 2002, James et al. 2009), radiometer amplitude (thermal radiation amplitude, Harris and Stevenson 1997b; Ripepe et al. 2005), thermal video (the video of the explosions provided in AVI format)

Sample quantification
To access to the sample quantification we use stratigraphic log and maps. The samples can be pyroclastic ash (particle < 2 mm in diameter), pumice and/or soria lapilli (particles between 2 and 64 mm in diameter) and bombs and or blocks (particle bigger than 64 mm in diameter), as well as fragment of lava (taken from the core or the crust of the lava flow unit).
The sample quantification class includes the fields: description (a brief description of the type of the sample), unit grain size (average size of the sample), grain size distribution (the data table provide the weight of the particles and their subdivision in the phi classes, as well as the statistical parameters, for the methodology see routine measurements), particle componentry (this data provide the subdivision of the sample in all sieved classes or in a few of them of the percentage of vesiculated juvenile, pumice or scoriae, dense juvenile, dense fragments that represent the primary magma involved in the eruption, lithic particle, lithic includes accidental and cognate particles that are not related with the fresh magma, for the methodology see routine measurement, crystals, the free crystals in the deposits that can be juvenile or lithics), morphology (this information can be qualitative and just state if the sample is angular, rounded etc or quantitative, when a data table provides the three axes dimensions, the diameter, the area and the volume of the particles), particle parameters in terms of their weight, density (calculated with the method provided in routine measurements), porosity (obtained for the density and the known magma density, reported in volcano or eruption details), isolated vesicles (is the percentage of isolated vesicle found with the he-picnometer, see routine measurements, see routine measurements), particle permeability (see routine measurements), particle glass chemistry (chemistry of the glass of the juvenile fragments, obtained with the probe), bulk chemistry (chemistry of the whole sample obtained with the ICP-AES.
The second part of this table is related to the textural measurements in terms of vesicle or crystal size distribution. For the methodology we refer to Shea et al. 2010 and the website http://www2.hawaii.edu/~tshea/foams/methodsimrec.html,           
This part includes: minimum size of vesicles counted (the minimum pixel considered at the highest magnification for the image analyses), particle crystal content (the percentage of crystals corrected for the vesicularity in each particle, the crystals can be subdivided in phenocrysts, usually bigger than 200-100 micron in diameter, microphenocrysts comprising between 200-30 micron in diameter and microlite, usually smaller than 30 micron in diameters. However, the three category are usually chosen identifying the main population in the crystal size distribution), number of counted crystals x particle (the number of crystal counted in each clast), number of counted vesicles x particle (the number of crystal counted in each clast, particle 2D integrated vesicularity (the percentage of vesicularity obtained after FOAM), particle vesicle number density (the total vesicle for unit volume, corrected for vesicularity and crystallinity), number of images x magnification x area (the number of images used, their magnifications and area), vesicle parameters in terms of their vesicle equivalent diameter (Eq Diameter in data tale), vesicle area (area in data tale), vesicle perimeter, vesicle long axis, vesicle short axis, vesicle orientation, image magnification (Magn type in the data table), bins (are the geometric classes used to group the vesicles size), 
Na (number of particle on the area unit for each class), Nv (the total vesicle for unit volume for each lass)

Mentions légales