 |
| |
Recherche |
|
Ground stations
Corinth Gulf
The Corinth rift is a high seismic area frequently affected by seismic swarms. In the last 35 years five earthquakes of magnitude larger than 5.8 have occurred along the rift while a North-South extension of 1.5 cm per year is observed.
In the recenet past, two major earthquakes occurred at the western tip of the rift (Galaxidi, M 5.8 in 1992, Aigion, M 6.2 in 1995).
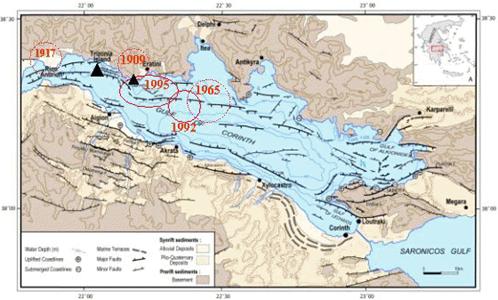 |
Scheme of Corinth gulf (after Moretti, 2003).
Location of the main recent destructive earthquakes.
Large and small black triangles indicate the location of Trizonia EM and Psaromita EM stations. |
Several monitoring networks were progressively set through a European project (CRL; http://www.corinth-rift-lab.org/index_en.html) to better measure, model and predict the processes leading to earthquakes.
EM studies and monitoring stations supported by the CNES were set in this multi-disciplinary context in order to better constrain the processes generating EM signals associated with tectonic activity.
The main EM station was set on Trizonia island where the faults have not broken yet. At Psaromita a second station was only recording the low frequency EM field in order to discriminate the natural signals generated by the tectonic activity from the man-made noise.
The EM station in Trizonia Island
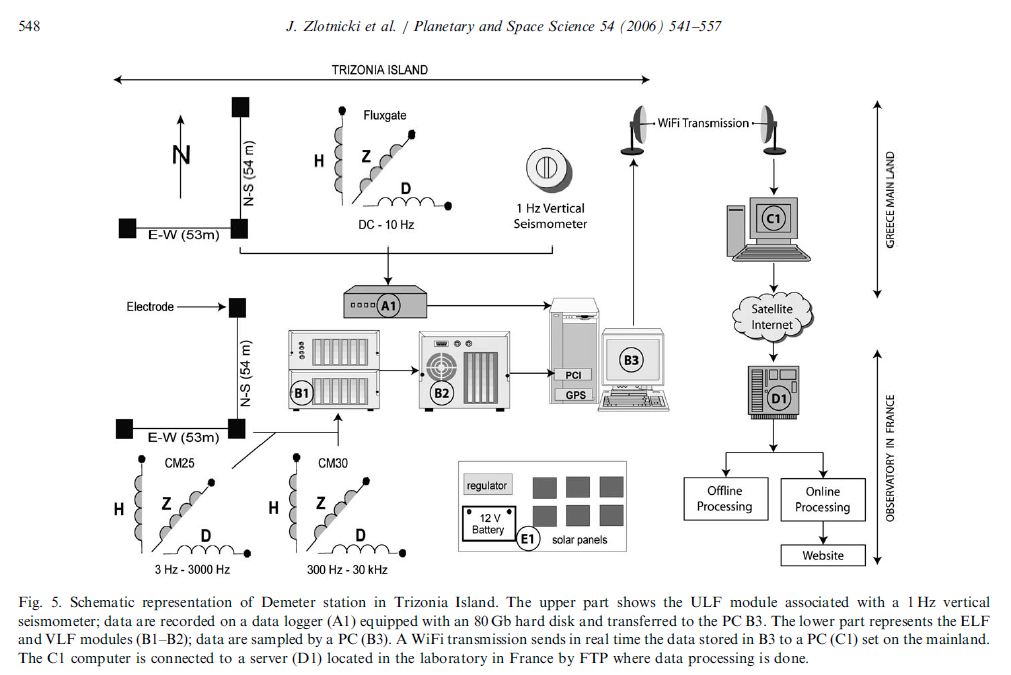
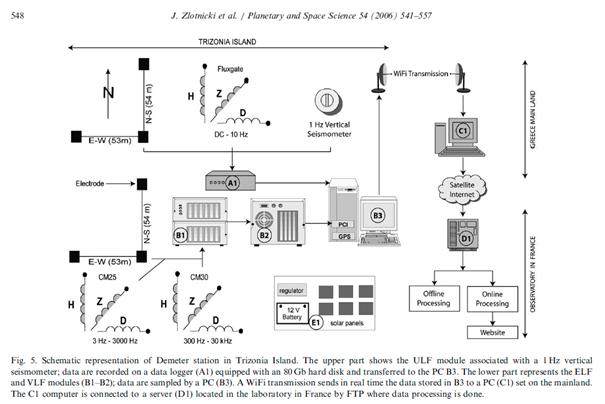
The objective of the station was to record the magnetic and electric fields from 10 kHz to DC. This large frequency domain has required to implement different specific sensors, in particular magnetic ones. The architecture was the following:
A PC computer located on the field experiment and equipped with a 8 channels, 24 bits resolution analogue-digital board, was controlling the data acquisition. Large mass storage of 600 Mo is attached to the system.
On this PC computer data are measured during 55 minutes at 1 kHz and 5 minutes at 10 kHz, repeatedly:
- Three orthogonal induction coils record the magnetic field in the VLF domain (frequency band of the sensors 0.3 kHz-30 kHz),
- Three orthogonal induction coils record the magnetic field in the ELF domain (frequency band of the sensors 3 Hz-3 kHz)
- Two horizontal buried electric lines of 50 m length record the electric field along the North-South and East-West direction.
- On a second 24 bits autonomous system records the EM field at 40 Hz sampling and transfers data to the PC computer:
- A fluxgate magnetometer records the three components of the magnetic field,
- Two horizontal buried electric lines of 50 m length record the electric field along the North-South and East-West directions. The electric sensors are non polarizing lead-lead chloride (Pb-PbCl2) electrodes buried at about 1 m depth,
- One 1 Hz vertical seismometer.
Far away of power lines the EM equipment is constrained to use high capacity batteries recharged by solar panels.
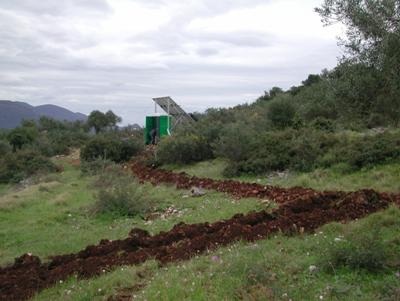
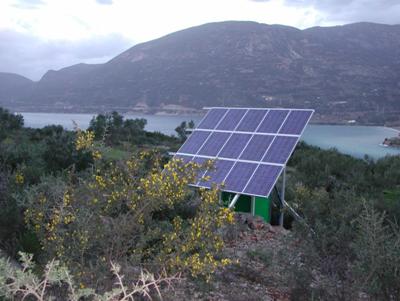
Construction of the EM station in Trizonia. The complete data acquisition system is in a hut.
The power supply is given by batteries recharged by solar panels.
In the front of the picture are the trenches in which the electric lines are buried.
Data transfer
A remote PC computer is set on the northern cost where power supply was available. The tasks of this computer were:.
- To collect data from the field experiment PC computer by a WIFI connection,
- To transfer some of the records by a satellite Internet bidirectional connection to the server set in the laboratory in France,
- To implement data processing on the files not sent by Internet satellite.
|
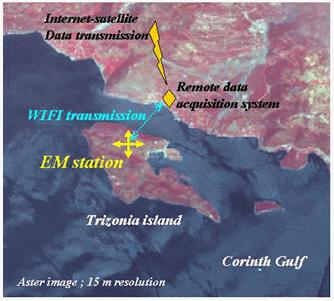
Scheme of the location of the EM field station in Trizonia island and of the remote PC computer on the northern cost for data transfer by satellite Internet connection.
A WIFI data transmission is used to send data from the field to the remote PC computer. |
Sensors and data logger characteristics
Corinth gulf |
ULF module |
Magnetic sensors |
Type
Analog output
Output noise
Thermal drift
Frequency band |
Fluxgate
5 mV/nT
2 pT rms
0.2 nT/°C
DC to 10 Hz |
Electric sensors |
Electrodes
Output noise
Thermal driff
Length |
Pb-PbCl2
1 mV rms
100 µV/°C
NS: 54 m; EW: 53 m |
Seismometer |
Type |
Vertical 1 Hz |
Acquisition 24 bits |
Resolution mag
Resolution elec
Frequency band |
0.1 pT
0.06 µV
40 Hz |
|
ELF module |
Magnetic sensors |
Type
Analog output
Output noise
Frequency band |
CM 25 induction coil
50 mV/nT
0.01 pT rms
3 – 3000 Hz |
Electric sensors |
Electrodes
Output noise
Length |
Stainless probes
1 mV rms
NS: 54 m; EW: 53 m |
Acquisition 24 bits |
Resolution mag
Resolution elec
Frequency band |
0.005 pT
0.24 µV
1000 Hz |
|
VLF module |
Magnetic sensors |
Type
Analog output
Output noise
Frequency band |
CM 30 induction coil
50 mV/nT
0.01 pT rms
300 – 30000 Hz |
Electric sensors |
Electrodes
Output noise
Length |
Stainless probes
1 µV rms
NS: 54 m; EW: 53 m |
Acquisition 24 bits |
Resolution mag
resolution elec
Frequency band |
0.005 pT
0.24 µV
10 KHz |
Shematic representation
Structure of data
data were recorded in binary.
In Matalb environment, reading the files cans be achieved by using the following script:
nb_col= 6; % Number of columns in the file (6 on the eight recorded are used)
% fichier de 6 colonnes : % seismic ns ew D H Z
s=input('repertoire et nom : ', 's');
fid = fopen(s, 'r', 'b');
fgetl(fid)
dat = fread(fid, inf, 'single');
data = reshape(dat,nb_col, size(dat,1) / nb_col)';
data=data(:,1:6);
fclose(fid);
% coefficients of normalization
Cs=400; % 400V/m/s (seimometer)
Cns= 10000/54; % electric data are therefore in mV/km
Cew= 10000/53; % electric data are therefore in mV/km
Cd= 200; % magnetic data are in nT
data(:,1)=data(:,1)/Cs;
data(:,2)=data(:,2)*Cns;
data(:,3)=data(:,3)*Cew;
data(:,4)=data(:,4)*Cd;
data(:,5)=data(:,5)*Cd;
data(:,6)=data(:,6)*Cd;
save data
|